At the 7ConNetwork Virtual Networking Conference in September 2021, Tobias Schenk presented a look at the world container fleet, operating capacities, and the container ship market.
The first portion of this webinar looked at the world container fleet and its capacities, and our previous blog on the shortage of container ships was based on their data and presentation.
Now, we're taking a look at the fleet capacities and geographic focuses of the top shipping carriers.
What Are the Fleet Structures of the Top 20 Shipping Carriers?
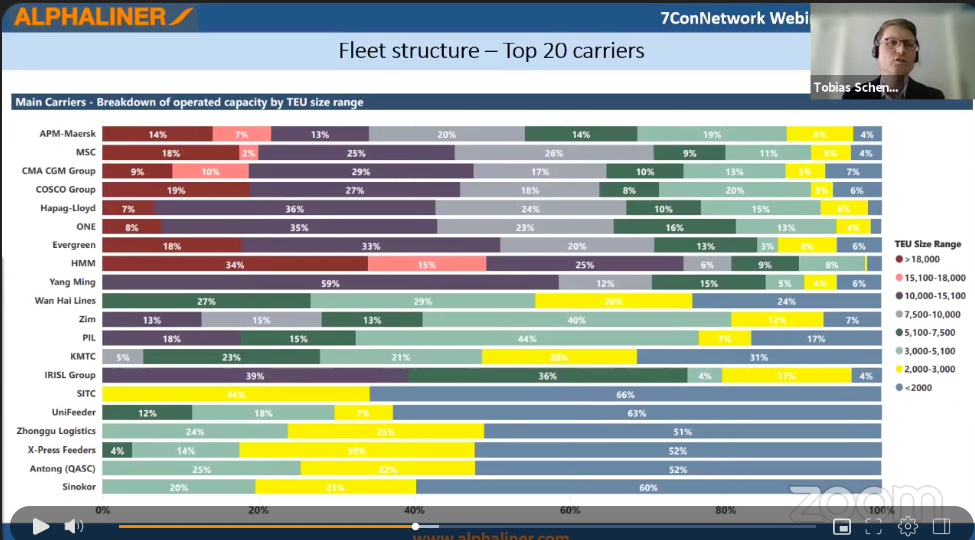
*Snapshot from Container Ship Market - Review and Outlook 2021. Watch the full presentation here.
The fleet structure of the top 20 shipping carriers is diverse as it relates to the trade and the market the individual carrier is operating in. The more markets a shipping group is operating in, the more diverse their fleet structure is due to the different nature and requirements of each market.
The Top 8 Shipping Groups
- APM-Maersk
- Mediterranean Shipping Company (MSC)
- Compagnie Maritime d'Affretement (CMA) and Compagnie Générale Maritime (CGM), known as CMA CGM Group
- China COSCO Shipping Corporation Limited (COSCO Shipping)
- Hapag-Lloyd
- Ocean Network Express (ONE)
- Evergreen Line
- Hyundai Merchant Marine (HMM)
These top 8 container carriers all deploy shipping vessels with more than 18,000 TEU capacity (megamax ships), which is necessary for their fulfillment along the main trade lanes of Asia-Europe, Asia-North America, and the trans-Atlantic trade lane.
European carriers, such as Maersk, Hapag-Lloyd, and MSC, have larger presence in the trans-Atlantic and Europe to Latin America trade lanes, which also explains why a large portion of their fleets are composed of mid-sized ships.
What Causes Fluctuations in Available Cargo Capacities?
2009: Available Tonnage Increased Due to the Shipping Crisis
After the financial crisis of 2007-2008 led to the shipping crisis in 2009, the shipping market experienced a sharp increase in cargo-carrying capacity (tonnage).
2010-2019: Available Tonnage Remained Relatively Stable
In the years after the 2009 crisis, the capacity was quite stable besides the usual fluctuations in demand due to seasonal circumstances.
Holidays like Chinese New Year (which usually occurs in January or February) and the Chinese holiday of Golden Week (which occurs in October) generally caused a decrease in demand. During these periods, carriers would actively remove capacities by planning structural blanking sailings to account for the reduced demand.
Early 2020: Available Tonnage Decreased Due to IMO 2020
In early 2020, there was a dramatic decline of available tonnage due to the International Maritime Organization (IMO) 2020 regulations. These regulations limit the sulfur in the fuel oil used on ships operating outside designated areas, and a lot of vessels were laid off or had to be refitted.
At the same time, it was the beginning of the COVID-19 pandemic with a lot of uncertainty in the market.
May 2020: Available Tonnage Increased Due to the COVID-19 Pandemic
Once the COVID-19 pandemic hit and many countries were in lockdown, e-commerce exploded since many people were working from home and needed laptops and other supplies. This created a sharp increase in demand, which significantly increased capacity in May 2020.
Who Are the Top 15 Container Carriers by Deployed Capacity?
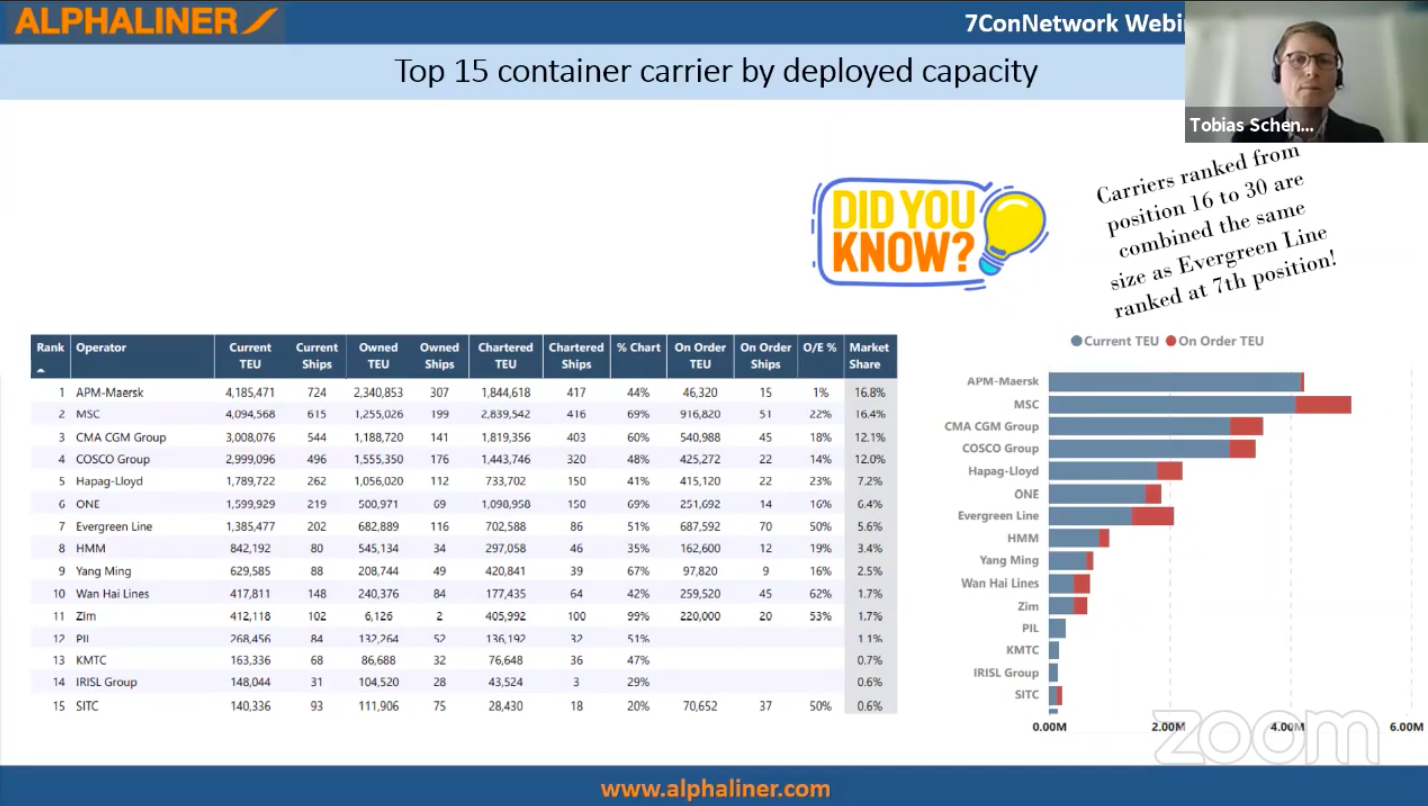
*Snapshot from Container Ship Market - Review and Outlook 2021. Watch the full presentation here.
The consolidation in the shipping industry we discussed in our previous blog on the world container fleet is visible in this chart.
The gaps between the different groups are dramatic, and the top carriers have significantly larger TEU capacities compared to smaller shipping lines. Evergreen, for example (ranked at position 7), has a TEU capacity that’s the same relative size as if you were to combine the TEU of carriers ranked 16 through 30 (which are not shown on the chart).
Maersk Soon to Move From #1 to #2
Based on boxship order books of new ships and aggressive purchasing in the second-hand market, MSC is set to overtake Maersk in 2022 as the largest shipping line. Maersk’s strategy is not to be the largest, as they are content to have a capacity around 4 million TEU.
Instead, their aim is to be a global logistics integrator and offer all relevant products and logistics services along the entire supply chain to its customers. However, their focus is on making long-term deals with beneficial cargo owners (BCOs) but only short-term deals with freight forwarders. This strategy will likely cause them to lose freight forwarders as clients.
What Trade Lanes Do the Top Container Carriers Operate In?

*Snapshot from Container Ship Market - Review and Outlook 2021. Watch the full presentation here.
Based on this chart, we can see that Hyundai Merchant Marine (HMM) is a far-east carrier, with 90% of their fleet capacity deployed on trades from and to Asia. Maersk’s operating capacity in Latin America is driven by Hamburg Süd’s participation, being a traditional South American carrier. Thirdly, Hapag-Lloyd has a relatively high share in the Europe to North America trade as being a traditional trans-Atlantic carrier.
The capacity deployed on the Asia-North America routes is now 21% (up from 17% in 2018) and now matches the 21% of active ships on the Asia-Europe lanes.
Overall, the geographical focus of the largest shipping carriers has remained relatively the same over the last 3 years.
Want to Stay Ahead of the Curve and Updated on Industry Knowledge?
To stay up to date on the latest freight forwarding and shipping trends, sign up for our newsletter.